
From scattered data.
To a clearer decision.
Connect the information you already collect to reporting your team can actually use.
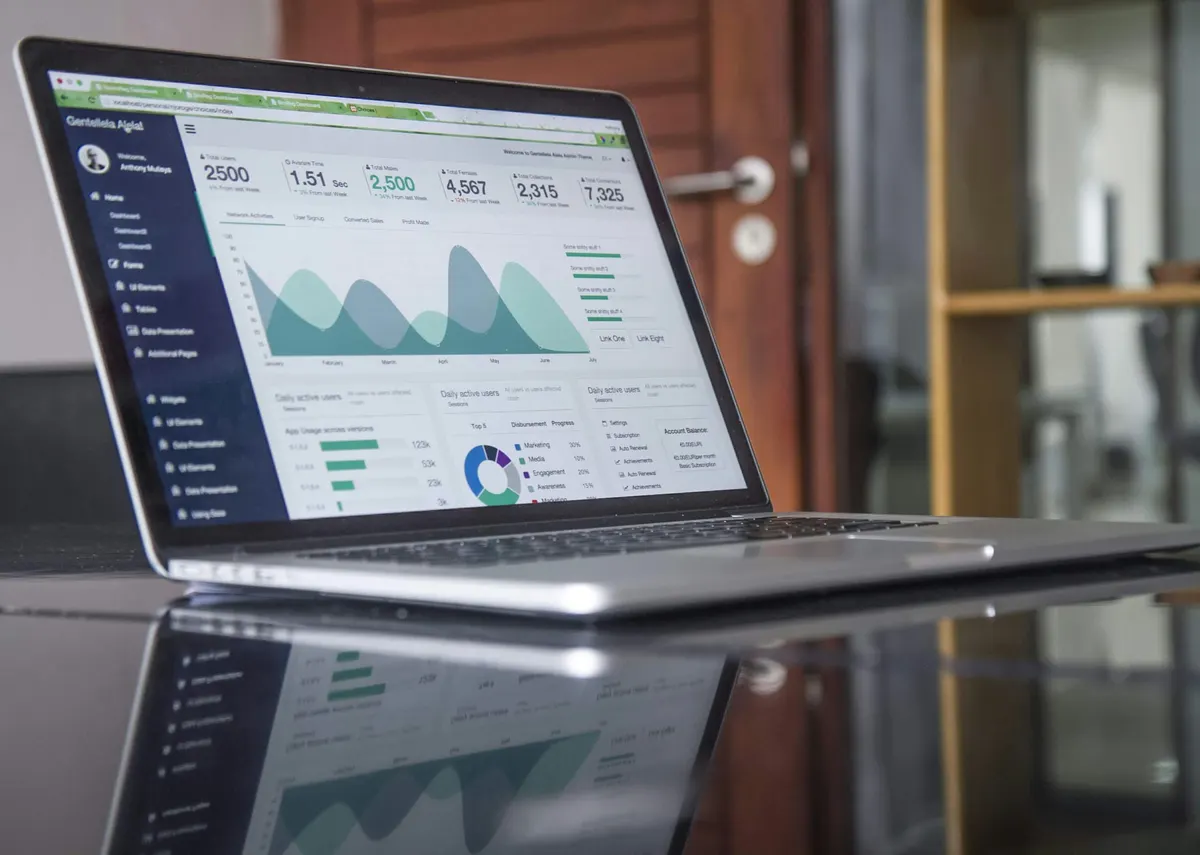
Built around the work.
Not the workaround.
Potential capabilities to explore during discovery. The right combination depends on your systems and requirements.
Operating dashboards
Bring agreed measures into a clear, role-appropriate view.
Reporting pipelines
Prepare recurring reports from defined sources instead of copying information by hand.
Decision support
Compare trends and flag exceptions, with the source and assumptions kept visible.
What does a business data intelligence engagement deliver?
A business data intelligence engagement identifies the decisions a team needs to make, maps authoritative sources, cleans and models the relevant data, defines measures, and delivers reporting or forecasting with known limitations. A dashboard is the interface; the durable work is the governed data model, definitions, refresh process, access controls, and tests underneath it.
See the work
move forward.
Explore a conceptual workflow. Start the example, review the decision, and approve the next step.
An invoice arrives. See how the information moves to a reviewed record.
An order arrives. Follow one record across connected systems.
A request arrives. Watch an agent prepare the work without taking the final decision.
Where this fits.
And where it doesn’t.
The second list is the more useful one. We would rather say no early than bill for a build that was never going to hold.
A good fit when
- There are named decisions, users, and measures rather than a general request for more data.
- The source systems contain enough stable identifiers and history to reconcile.
- A business owner can approve definitions and resolve conflicts between systems.
- The team will maintain source quality and act on the resulting information.
Not the right build when
- There is no decision or owner attached to the requested dashboard.
- The available history is too sparse, inconsistent, or structurally changed for the proposed forecast.
- The goal is to transfer an industry benchmark or another company’s result into a local guarantee.
- Sensitive data would be combined without a defined purpose, permission model, minimization, and retention plan.
More than a build.
A working capability.
Deliverables, responsibilities, and acceptance decisions are agreed in writing for the engagement. No price or schedule is implied here.
Decision and source inventory
Users, questions, current reports, systems, identifiers, owners, refresh needs, data risks, and baseline reporting effort.
Data-quality and reconciliation report
Missing values, duplicates, timing differences, invalid records, conflicting definitions, exclusions, and remediation priorities.
Governed analytical model
Fact and dimension design, stable measures, data dictionary, lineage, access rules, refresh jobs, and validation tests.
Reports and decision views
Focused dashboards, scheduled outputs, alerts, drill-through, filters, and explanatory context for the named decisions.
Forecast or experiment layer when justified
Baseline comparison, feature and window definitions, holdout evaluation, uncertainty, limitations, monitoring, and fallback.
A few useful answers.
Start with a conversation. The detail belongs in discovery and the written scope.
Published by Vail Valley AI Engineering Team · reviewed . Editorial policy
Do we need a data warehouse?
Not always. The answer depends on source count, volume, history, refresh, shared definitions, access, and reuse. A smaller governed model may be enough; repeated pipelines and several consumers may justify a warehouse.
Can you combine spreadsheets and software data?
Yes, when each source has defined ownership, stable identifiers, validation, and a clear grain. A spreadsheet should not silently override a system record without an agreed rule.
Can you build forecasting?
Yes when the decision, history, operating conditions, evaluation window, and acceptable error are defined. A forecast can also be rejected if a simple baseline performs as well or the history is not representative.
How do we stop teams arguing about metrics?
Name a measure owner, publish its formula, source, grain, timing, exclusions, and change history, then make reports reuse that governed definition.
Do dashboards guarantee better decisions?
No. They can make evidence timely and consistent, but the business still needs an owner, an action, and a review process. Adoption and decision effects must be measured separately.
Bring us your
biggest challenge.
Whether you have a clear plan—or just a “there has to be a better way”—we’d love to hear from you.
Talk about data intelligence & analytics
Tell us what’s slow, manual, or breaking. We’ll say honestly whether it’s worth building—including when the answer is no.